Largest Annual Spike in Public School Spending in Over 20 Years
Average U.S. public school spending per pupil in elementary and secondary schools rose 8.9% to $15,633 in fiscal year (FY) 2022 from the previous year, according to the U.S. Census Bureau’s most recent Annual Survey of School System Finances data.
While statistics are not adjusted for inflation or cost-of-living differences, this change marks the largest year-to-year percentage increase in over two decades.
States with the highest per pupil spending:
- New York ($29,873).
- District of Columbia ($27,425).
- New Jersey ($25,099).
- Vermont ($24,608).
- Connecticut ($24,453).
States with the lowest per pupil spending:
- Utah ($9,552)
- Idaho ($9,670).
- Arizona ($10,315).
- Oklahoma ($10,890).
- Mississippi ($10,984).
All nine states in the Northeast region ranked in the top 14 for current per pupil spending and seven were in the top 10.
Sixteen of the 20 states with the lowest per pupil spending were in the South or West. Iowa, Missouri, Indiana and South Dakota were the remaining four states.
Among the nation’s 100 largest school systems by enrollment, the New York City School District in New York ($35,914) spent the most per pupil in FY 2022, followed by Washington Schools in the District of Columbia ($27,425); San Francisco Unified in California ($23,654); Atlanta School District in Georgia ($22,882); Los Angeles Unified in California ($21,940); and Detroit School District in Michigan ($21,771).
Federal Revenue Increased Significantly From FY 2021 to FY 2022
The New York City School District ($38.5 billion) and Los Angeles Unified ($12.5 billion) — both among the highest-spending districts — received the most combined federal, state and local revenue of the 100 largest school systems by enrollment.
New York City School District received 6.6% of its FY 2022 revenue from federal sources; 29.8% from state sources; and 63.6% from local sources. In contrast, Los Angeles Unified received 19.2% of its FY 2022 revenue from federal sources; 54.5% from state sources; and 26.3% from local sources.
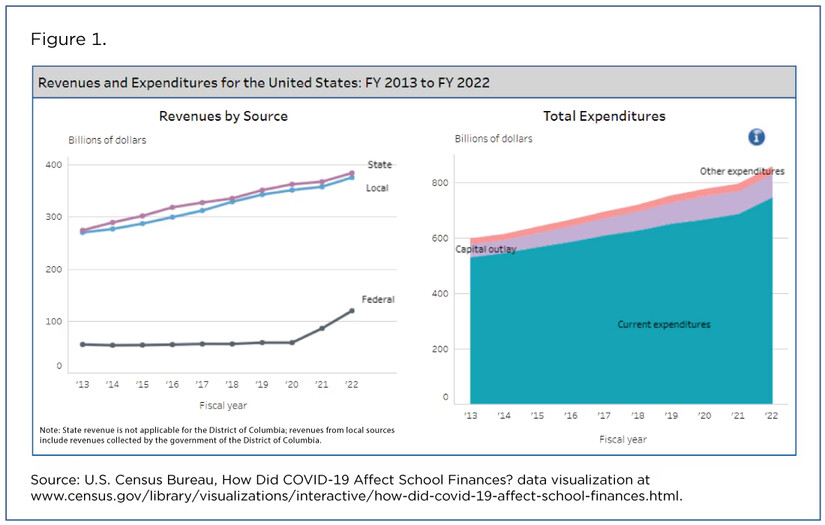 The national average of revenue received from federal sources was 13.6%; 43.7% from state sources, and 42.7% from local sources. (Figure 1)
(This screenshot is part of a larger dashboard to be published April 25th at: How Did COVID-19 Affect School Finances? (census.gov))
Federal revenue increased 39.6% from FY 2021 to FY 2022 and 47.6% from FY 2020 to FY 2021. These increases were largely the result of the legislative response to COVID-19, such as the Coronavirus Aid, Relief, and Economic Security (CARES) Act; Coronavirus Response and Relief Supplemental Appropriations Act 2021 (CRRSA); and the American Rescue Plan (ARP) Act.
Food Services and Transportation Expenses Rebound
While Instructional Salaries ($266.4 billion) continued to account for the largest category in current spending nationwide, there was a significant increase from FY 2021 to FY 2022 in both Food Services and Transportation expenditures as schools returned to in-person learning.
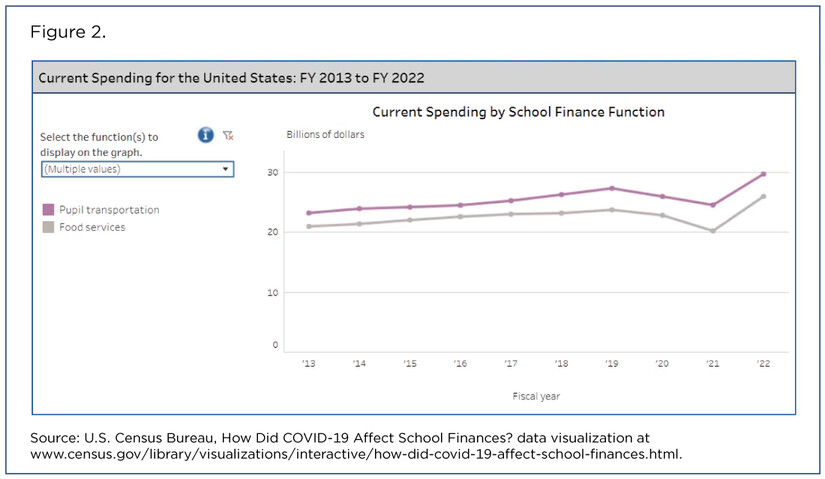 The decrease in FY 2020 and FY 2021 from prior years was a direct cause of distance learning prompted by the COVID-19 pandemic (Figure 2).