Image
2020 saw the highest U.S. fatality rate for motor vehicle accidents since 2007 with 1.37 fatalities per 100 million vehicle miles traveled. As many Morristown residents prepare to hit the road this holiday season, Morristown Minute compiled research from the National Highway Traffic Safety Administration, the National Academy of Sciences, Engineering, and Medicine, and the U.S. Census Bureau to determine the most dangerous highways in the United States based on fatalities per 100 vehicle miles traveled.
Your likelihood of being in a fatal motor vehicle accident varies dramatically based on the road on which you’re traveling. According to the Fatality Analysis Reporting System, vehicle fatalities increased approximately 7.2% from 2019 to 2020 despite U.S. drivers driving 13.2% fewer miles in 2020 than in 2019.
The decrease in vehicle miles traveled combined with an increase in fatalities per 100 million miles dramatically increased the fatality rate from 2019 to 2020 to 26% with a fatality rate of 1.37 per 100 million motor vehicle miles traveled.
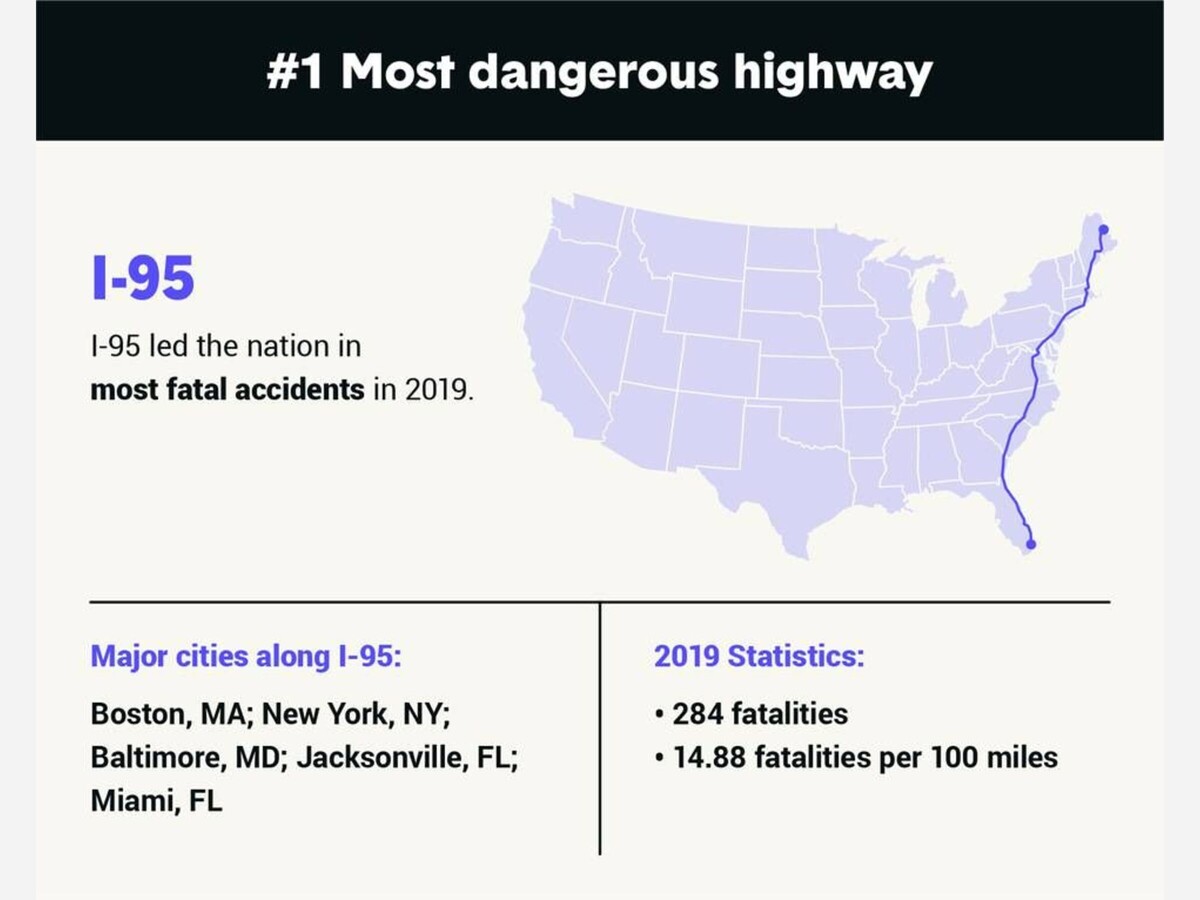
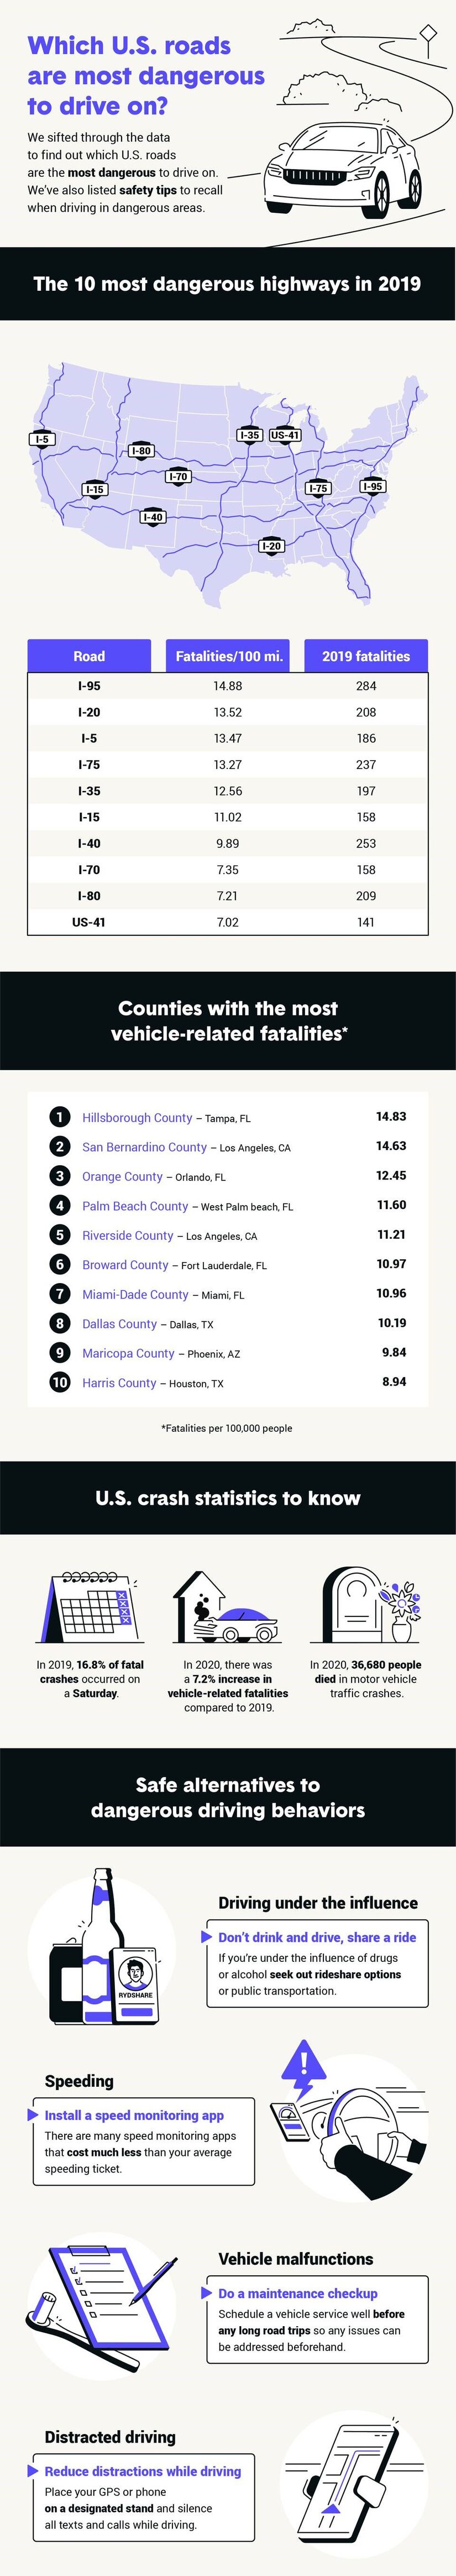
Based on an analysis of motor vehicle collisions, total fatalities, and miles driven, the most dangerous highway in the United States is Interstate 95, running north to south down the east coast. If you are traveling this holiday season beware of the ten most dangerous highways in the U.S. and know the most dangerous highway runs right through New Jersey.
Our data is based on 2019 data as information for 2020 and 2021 is incomplete. To determine the most dangerous highway, we analyzed the total number of motor vehicle collisions, the rate of fatalities, and the number of miles traveled on the highway in question.
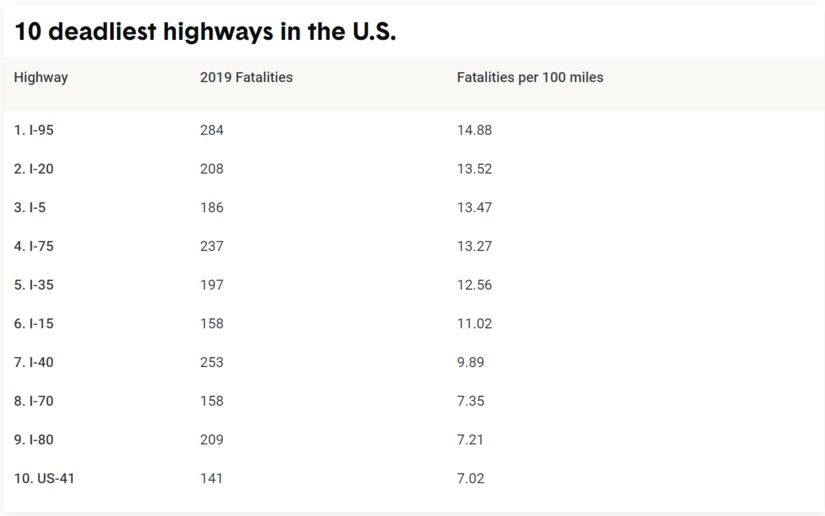
We found that in 2019, six of the top ten most dangerous highways ran north to south, and 59% of total motor vehicle fatalities occurred on highways running north to south. I-95 along the east coast and running through New Jersey had the highest number of fatalities in 2019 for any highway with 284 deaths and 14.88 fatalities per 100 miles traveled.
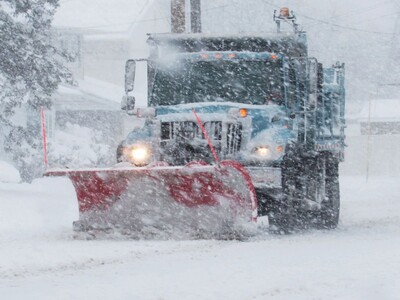
Accidents on I-95 occurred most often in the Northeast during the winter months when road conditions are exceedingly dangerous.
The most dangerous roadways are typically interstate highways that intersect with densely populated cities and counties. California contains portions of three of the deadliest highways in the U.S. (I-5, I-15, and I-80) all of which run through dense populations. Similarly, Texas and Florida contain portions of two of the most dangerous U.S. highways (TX: I-20 and I-35; FL: I-75 and I-95) which run through the states’ most densely populated cities.
Since I-95 cuts right through New Jersey, Morristown Minute compiled information on how to best protect yourself from a motor vehicle accident and what you can do to increase your safe driving behaviors.
Speed: the median speed in metropolitan areas saw a 22% increase from 2019 to 2020. To put this in context, a 10% change in mean traffic speed has a statistically significant impact on the increase in motor vehicle fatalities whereas a 10% increase in traffic volume has little impact on motor vehicle fatalities. It appears that no matter how many people are on the road, the faster you go the more likely you are to be in a fatal crash.
Seatbelts: first responders often struggle to identify if crash victims were wearing their seatbelts, and the statistics for this are unreliable. Therefore, we will use ejection rate as a surrogate measure for seatbelt use as those who wear their seatbelt are significantly less likely to be ejected from a vehicle.
From September 10, 2019, to March 16, 2020, prior to the COVID-19 public health emergency, unknown seatbelt use was at 14% (% of people ejected during a motor vehicle crash). From March 17, 2020, to July 18, 2020, that number increased to 19%. Then, from July 19 to September 30, 2020, the ejection rate increased once more to 24%. We can therefore assume seatbelt usage decreased during 2020.
Alcohol and drug use: The prevalence of U.S. drivers' driving under the influence increased during the COVID-19 pandemic as blood tests of fatally injured victims showed an increase in the appears of cannabinoids, opioids, and alcohol. Five trauma center studies conducted between July and September of 2020 revealed that nearly one-third of fatally injured drivers had alcohol in their system, 26% were positive for cannabinoids, and 13% tested positive for opioids.
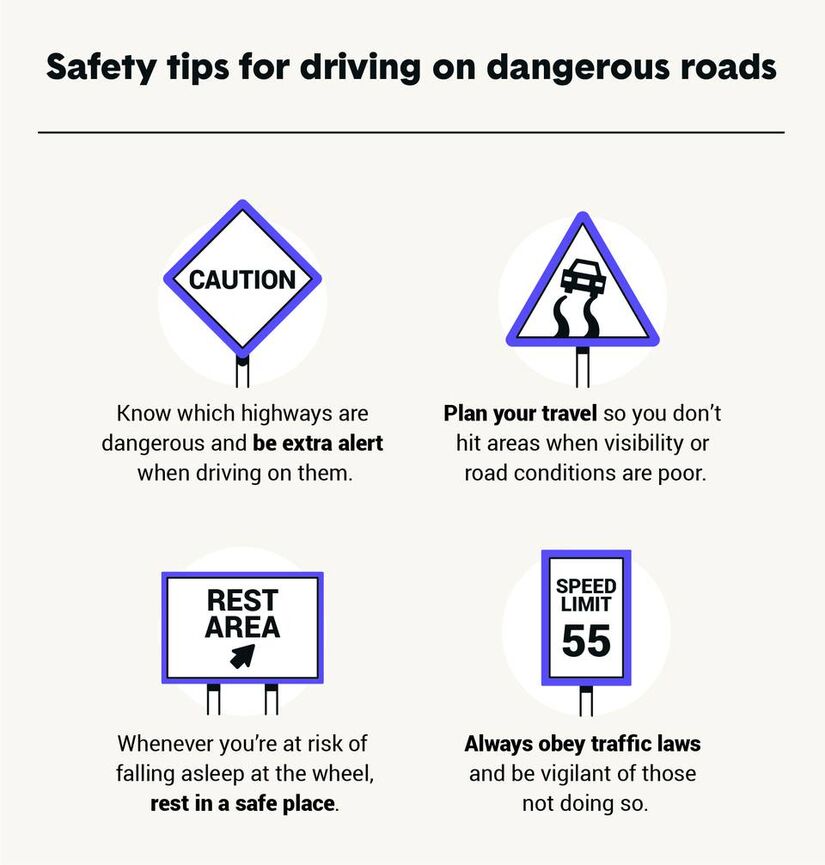
Be alert: know which roads are most dangerous and drive defensively.
Plan ahead: know traffic patterns and where people tend to speed. Keep an eye on weather and road conditions as the winter months are most dangerous for northeastern driver’s ad construction on roads only adds difficulty to driving.
Rest: lookout for signs of exhaustion, as many are planning on making long car rides to visit loved ones this holiday season. Signs of exhaustion can be anything from yawning, excessive blinking, difficulty recalling the last few miles traveled, missing your exits, drifting lanes, and other signs of sleepiness. If you find yourself struggling to stay awake and alert, switch drivers or pull over to a rest stop or safe location to take a nap and rest your eyes.
Obey traffic laws: avoid a ticket and keep yourself and your passengers safe by obeying speed limits and road signs. Obeying traffic laws makes drivers less likely to be involved in a fatal motor vehicle accident.
Finally, a couple more useful stats to know:
Most motor vehicle fatalities occurred on a Saturday in 2019.
In 2020, the U.S. saw a total of 36,680 deaths from motor vehicle accidents.
Sources:
Elvik, R. (2005). Speed and Road Safety: Synthesis of Evidence from Evaluation Studies. Transportation Research Record, 1908(1), 59 69. https://doi.org/10.1177/0361198105190800108
Examination of the Traffic Safety Environment During the Second Quarter of 2020: Special Report, 2020-10-01, DOT HS 813 011. https://rosap.ntl.bts.gov/view/dot/50940
Bureau, U., 2021. State Population Totals and Components of Change: 2010-2019. [online] Census.gov. Available at: <https://www.census.gov/data/tables/time-series/demo/popest/2010s-state-…; [Accessed 26 November 2021].
Office of Behavioral Safety Research. (2021, January). Update to special reports on traffic safety During the COVID-19 public health emergency: Third-quarter data. (Report No. DOT HS 813 069). National Highway Traffic Safety Administration.
https://www.nhtsa.gov/file-downloads?p=nhtsa/downloads/FARS/2019/National/


Sunny, with a high of 66 and low of 46 degrees. Sunny in the morning, clear for the afternoon and evening,