Image
Traditionally, Mayors oversee a city's many public departments, including police, fire, education, housing, and transportation. They serve as the city's Chief Executive, with the power to appoint and remove commissioners to these departments.
Their responsibilities vary depending on the local power structure, but they generally include the welfare of the city/town.
A Mayor's traditional responsibilities are exercised in two main ways:
1. A policy-making role, recommending policies to the council, breaking tie votes, and vetoing legislation.
2. An executive role, seeing that laws are enforced and that city officers and employees properly do their job.
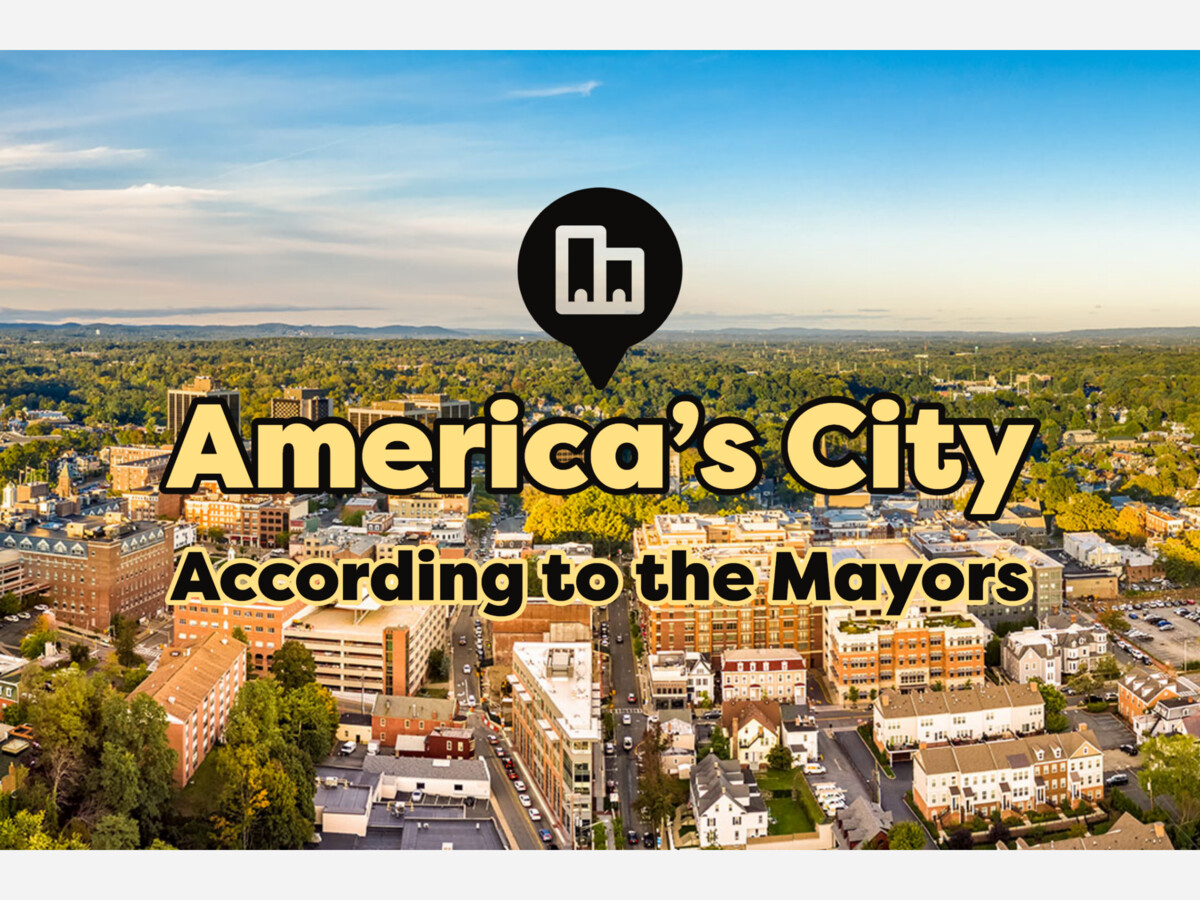
The Mayor's opinion has a lot of impact on your everyday life, so let's consider what "America's Mayors" think our city's greatest challenges are.
From Fast Company’s National League of Cities’ annual report, the Top Ten Concerns in U.S. Cities According to Their Mayor’s
Health Care – # 10 mentioned in 18% of speeches
“I have personally seen the devastation that heroin addiction brings to a family.” — Baltimore Mayor Stephanie Rawlings-Blake.
The opioid epidemic is a major health care crisis spread across all cities in the U.S. Every day more than 100 Americans die from drug overdoses. In 2019, an average of 38 people died each day from opioid overdoses, totaling over 14,000 deaths.
"The opioid-related overdose death rate for the national population increased from 2.9 deaths per 100,000 people in 1999 to 14.9 per 100,000 in 2017—with a large increase in overdose deaths involving synthetic opioids..." - U.S. DOHHS, Substance Abuse and Mental Health Services Administration, Office of Behavioral Health Equity
Access to health care, such as mental health care and substance abuse treatment, is crucial to battling the opioid epidemic
in America's cities.
In 2020, the US Census reported that 8.6% of adults did not have insurance at any point during the 2020 calendar year.
According to the 2020 US Census, private health insurance continues to be most common form of coverage, with 66.5% of the population. And 54.4% of the population received employment-based private health insurance for some or part of the 2020 year.
The next most common forms of coverage were Medicare, Medicaid, direct-purchase coverage, TRICARE, and Department of Veteran Affairs, respectively.
. . .
Mayor's concern themselves with health care because it touches so many aspects of our lives. It takes rigorous, efficient, and effective public departments to ensure the health and safety of an entire city.
As the elected official tasked with ensuring the well-being of a large community, health care should always be on the top of their mind.
A Note on Mental Health Services & School-based Mental Health Services,
“Fewer than 20% of children who need mental health care actually receive any services, fewer than 50% received the appropriate service relative to the need” – Issues in Clinical Psychology, School-Based Mental Health Services in Urban Communities
“We need to focus on new technologies, because the solutions we envision today may be obsolete 10 years from now.” — Nashville Mayor Megan Barry.
Technology is the key driver of economic growth in cities. Technological progress allows for the more efficient production of better goods and services - exactly what a city's prosperity depends on.
In 2021, Forbes identified the top five Emerging Tech cities in the U.S. –
Meanwhile in New Jersey...
Employment in Information/Technology decreased by 0.6% between 2013-2018 in NJ, but the jobs are only multiplying. Meanwhile, NJs GDP saw 1.9% Annualized Growth from the Information/Technology Sector between 2013-18 - on the low side of what New Jersey sees annually from IT.
“We are focused on fostering greater diversity and inclusiveness. We know our diversity is one of our great strengths, which is why we have been recognized nationwide as one of the best cities for women, for African Americans, for new Americans and for the LGBT community.” — Columbus, Ohio, Mayor Andrew Ginther.
According to UC Berkeley’s Othering & Belonging Institute (OBI), Hawaii is the most inclusive state in the U.S. while Louisiana ranks last.
New Jersey ranks #21 in Inclusivity, based on an “Inclusivity Index” that factors “a range of social dimensions, including race/ethnicity, religion, disability, and sexual orientation.”
“We’re doing our part here at home to answer our moral obligation and build the clean energy economy that is necessary to cool our planet.” — Atlanta Mayor Kasim Reed.
According to the American Council for an Energy-Efficient Economy’s 2021 City Clean Energy Scorecard, which analyzed 100 cities across all 50 states, the Most Energy-Efficient Cities in America in 2021 were -
Newark, New Jersey ranked 73/100 in Energy-Efficiency.
“[The city] will work through the Housing Authority and with the private sector to incentivize the creation of more workforce and affordable housing where it’s needed most.” — Charleston, S.C., Mayor John Tecklenburg.
Most Expensive States to live in 2022:
Least Expensive places to live in 2022:
“The impact of this skills gap is particularly harsh on low-income communities–especially for our young adults.” — San Diego, Calif., Mayor Kevin Faulconer
According to World Population Review, the States with the best school systems are -
New Jersey public schools have a 91% 4-year graduation rate and 1% dropout rate.
“Our Vision Zero Action Plan made 2015 the safest year on New York City roads for everyone—pedestrians, cyclists, and motorists—since 1910.” — New York Mayor Bill De Blasio.
New Jersey has among the worst infrastructure in the country.
US News and World Report ranked New Jersey 41st in 2022 for the condition of State infrastructure.
“[This year’s budget] supports our neighborhoods and our young people. We’ll be able to demolish dangerous buildings and invest more in summer youth employment.” — Kansas City, Mo., Mayor Sly James
Fiscal Stability by state, from US News and World Report -
New Jersey is ranked #49, next to the least fiscally stable state in the United States.
“[The murder rate], which had dropped significantly in 2013 and 2014 has followed the national trend and is back up again.” — Oklahoma City, Okla., Mayor Mick Cornett (though the city saw its overall crime rate decrease 10% from last year.)
“In fact, children in low-income, urban settings are exposed to violent crime rates that exceed the national average by 4 to 10 times.” – National League of Cities
The safest states, according to US News and World Report rankings are:
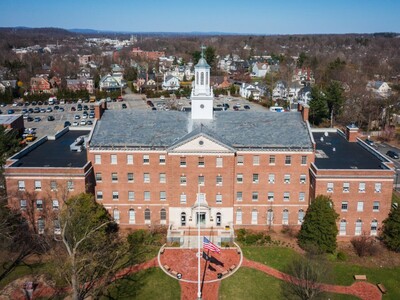
According to CrimeGrade.org, Morristown is safer than 79% of US cities and received an A- from Crime Grade for safety. The crime rate is 16.79 per 1,000 residents each year - on average 336 people are a victim of a crime in Morristown each year.
Additionally, your chances of being a victim of a crime range from as high as 1 in 24 to as low as 1 in 143 depending on your location in Morristown.
“Small, independent businesses from craft brewers to design firms, bakeries, and salons are popping up all along our streets and in our squares. So just like our thriving maker community, we’re working to handcraft our future.” — Somerville, Mass., Mayor Joseph Curtatone
In New Jersey, certain sectors drive more GDP and employ more workers than others. Raw numbers don’t always tell the whole story, so we'll factor in employment and GDP growth over the past five years and give you a deeper understanding of the economic situation in New Jersey.
Largest GDP growth by sector in New Jersey, between 2013-2018
The largest growth in employment by sector in New Jersey, between 2013-2018
More changes and additions will continue to come, check back to this article for updates.
Follow Morristown Minute on Facebook, Instagram, and Twitter for more local and state updates.

Sunny, with a high of 61 and low of 39 degrees. Sunny for the morning, partly cloudy in the afternoon, clear in the evening,