Image

Healthcare spending is rising faster than the state’s target, with higher commercial prices, concentrated markets, and workforce strain colliding with uneven burdens across race, income, and geography

New Jersey’s health care spending rose sharply in the most recent year measured by the state’s affordability program, outpacing the cost-growth target that policymakers set to keep care from becoming steadily less reachable for families, employers, and public budgets.
In a January 2026 benchmark report issued under the state’s Health Care Affordability, Responsibility, and Transparency (HART) Program, per-person total health care expenditures increased 6.1% from 2022 to 2023, rising from $10,663 to $11,319. The state’s benchmark target for that period was 3.5%, meaning statewide growth exceeded the target by 2.6 percentage points, according to the report.
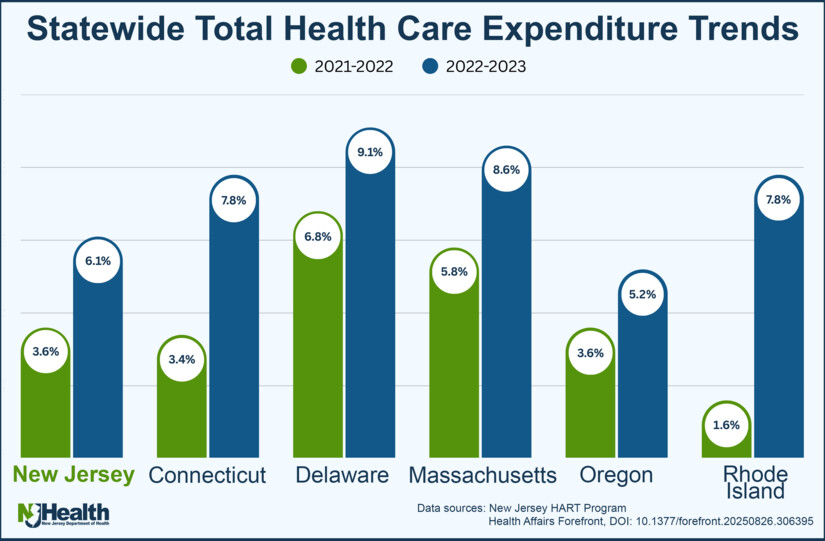 States across the country struggle to rein in the cost of health care
The increases were broad across insurance markets. On a per-person basis, total medical expenses grew 5.4% in the commercial market, 7.0% in Medicare, and 7.4% in Medicaid between 2022 and 2023, the benchmark report found.
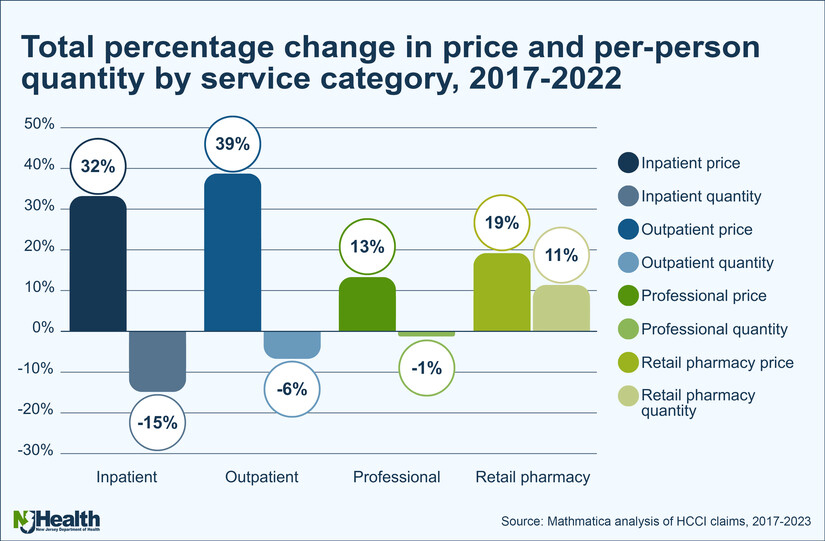
One of the most consistent findings across New Jersey’s affordability work is that spending growth in the commercial market has been driven more by higher prices than by residents using substantially more care.
A governor’s-office summary described the pattern this way: “rising health care prices - and not increased use of services” drove commercial spending growth, and New Jersey’s per-person spending grew faster than the national average over the period studied.
The state’s January 2026 cost-driver report on commercial insurance (2017–2022) similarly highlights a price-led pattern, especially in outpatient settings. It reports that in the years analyzed, increases in average price were a key driver of spending across multiple service categories, with notable increases in outpatient facility prices in several periods.
A separate “Hospital Labor Costs Special Report” released this month adds another price-pressure layer: hospitals’ operating costs per discharge rose substantially over time, with labor a major component of hospital expenses and New Jersey’s labor costs per discharge reported above national figures in the report’s comparisons.
 Spending per person in New Jersey is growing faster than the national average rate, a gap that has widened from 12 percent in 2016 to 15 percent in 2021
Health economists have long linked hospital consolidation to stronger bargaining leverage with insurers and higher negotiated prices in many markets. In New Jersey, hospital consolidation has been significant enough to draw attention from researchers focused specifically on the state.
A 2024 study of New Jersey hospital markets found that by 2020, six hospital market areas accounting for 71% of admissions were considered “highly concentrated” under federal standards. The same study reported that Morristown’s hospital market area had the highest concentration level among those examined (HHI 0.58), a measure commonly used in antitrust analysis to describe market concentration.
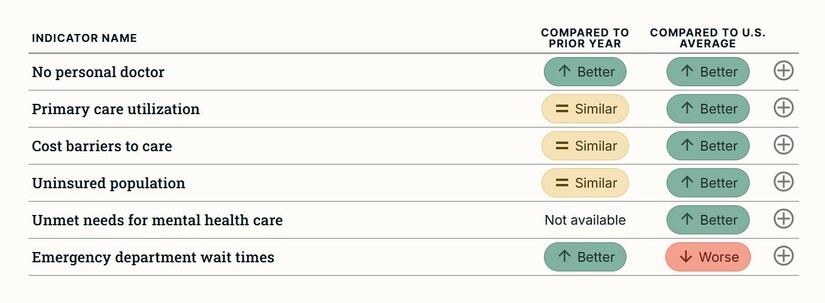 Two indicators, the percentage of adults with no personal doctor and emergency department wait times show improvements compared to the prior year’s performance
Those structural conditions do not automatically translate into a single price outcome for every service, but they can shape negotiations and limit competitive pressure in ways that affordability programs monitor closely.
New Jersey’s “landscape” indicators work tries to show that affordability is not only about statewide averages, but about who absorbs the most strain and where.
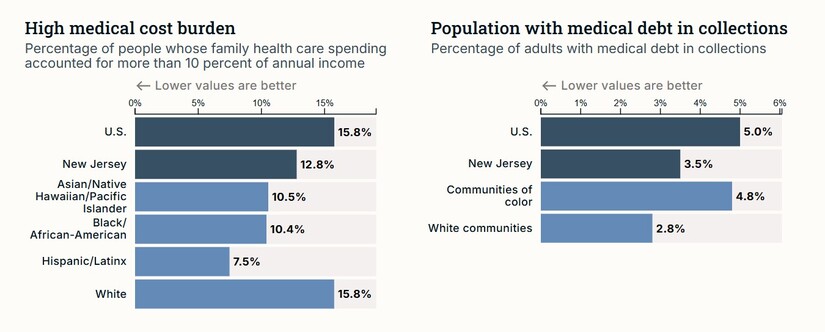
A state summary of HART’s landscape indicators reported that medical cost burden is highest among low-income residents, that Black residents experienced the worst health outcomes on the measures highlighted, and that residents of Hispanic and Latino heritage fared worst on certain access measures. It also reported a geographic pattern: counties performing better than the state average on quality measures were more likely to be in North or Central Jersey, while weaker performance clustered more in other parts of the state.
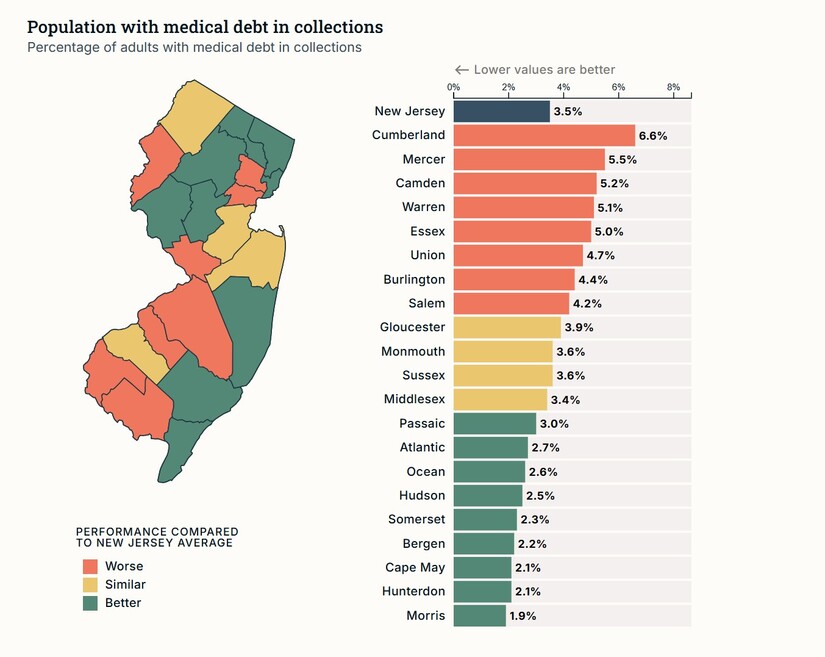
The underlying landscape report (September 2024) provides additional detail on how different measures can diverge by group. For example, it reported that the “medical cost burden” measure was highest for residents in the lowest income group (by the report’s definition) and showed variation across race and ethnicity depending on the metric used.
At the county level, the same landscape report shows sharp differences in utilization and access indicators that can translate into real-world affordability stress. For instance, Morris County appeared among the better-performing counties on several measures included in the exhibit (such as lower preventable hospitalization and comparatively low uninsured rates), while other counties posted higher rates on those same indicators.
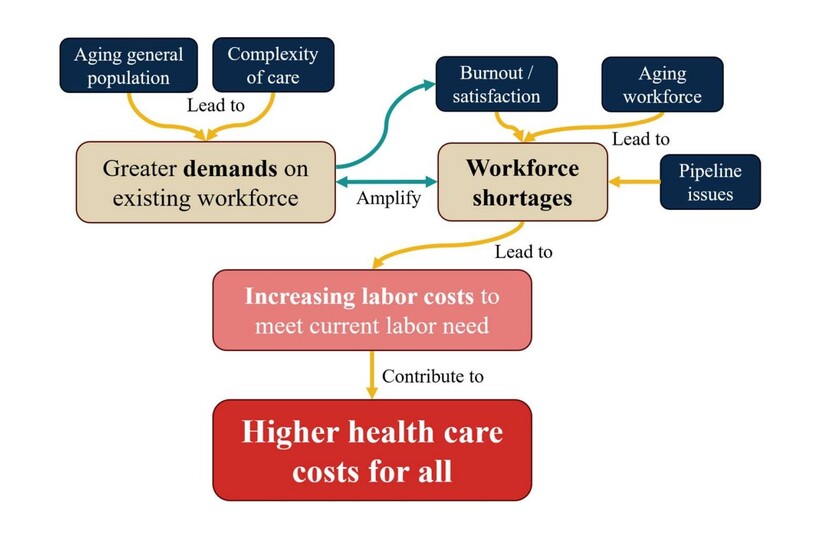
Cost is not only about negotiated rates and premiums. It is also shaped by whether the system can staff clinics, hospitals, and long-term care facilities at sustainable levels.
New Jersey’s nursing workforce data underscores that supply constraints are a live issue. The New Jersey Collaborating Center for Nursing’s 2025 report states that New Jersey is among 10 states projected to face the largest registered-nurse shortages by 2036, citing federal workforce projections.
 Health care workforce landscape
When staffing is tight, hospitals and other providers often compete more aggressively for workers, which can raise wage costs, increase reliance on more expensive short-term staffing, and contribute to broader price pressure. The state’s hospital labor-cost report frames labor and related expenses as a central part of hospital cost structure, even as it examines multiple contributors to rising operating costs.
Looking ahead, the state’s affordability project is attempting to do two things at once: keep measuring what is happening, and push the system toward slower growth.
The HART program itself was launched by executive order in late 2021, with the state setting targets intended to slow cost growth and increase transparency across insurance, hospitals, providers, and pharmaceuticals. The program’s blueprint describes a path that started with a 3.5% benchmark and envisioned gradually lower targets over subsequent years, while accounting for uncertainty in health care demand and the broader economy.
At the same time, national pricing dynamics continue to land in New Jersey paychecks because so many residents rely on employer-sponsored coverage. A KFF employer survey reported that the average annual premium for employer-sponsored family coverage reached $26,993 in 2025, up 6% from 2024, with workers contributing $6,850 on average. Reuters reported that employers and insurers pointed to factors including costly prescription drugs, notably GLP-1 medications, and higher use of services, with a similar increase projected for 2026.
For residents in Morristown and the wider Morris County area, the affordability story can look like a paradox: many local quality and access indicators appear relatively strong compared with state hotspots, yet premiums, deductibles, and negotiated commercial prices still flow through household budgets and employer benefit decisions.
And the structural story is local, too. The Morristown hospital market area has been identified by researchers as among the most concentrated in New Jersey, which can influence the bargaining environment in which prices are set.
The state is trying to do two things at once: keep measuring what is happening, and push the system toward slower growth through benchmark accountability and transparency.
The next big questions are whether New Jersey can meaningfully slow price growth in concentrated markets, whether employers and insurers shift more costs to workers as national premiums keep rising, and whether workforce constraints increase the “need-to-pay” side of the equation even as the state’s analyses show other cost components playing major roles.
Bring Meaning Back to the News: Go to TheMinuteman.org to get simple explanations of the trending topics in the news.

Sunny, with a high of 58 and low of 30 degrees. Sunny in the morning, clear during the afternoon and evening,


