
Image
From airline operation data collected over the year 2021, the U.S. Department of Transportation released its Air Travel Consumer Report detailing “on-time performance, mishandled baggage, mishandled wheelchairs and scooters, complaints received, and oversales.”
“The ATCR and other aviation consumer matters of interest to the public can be found at https://www.transportation.gov/airconsumer.”
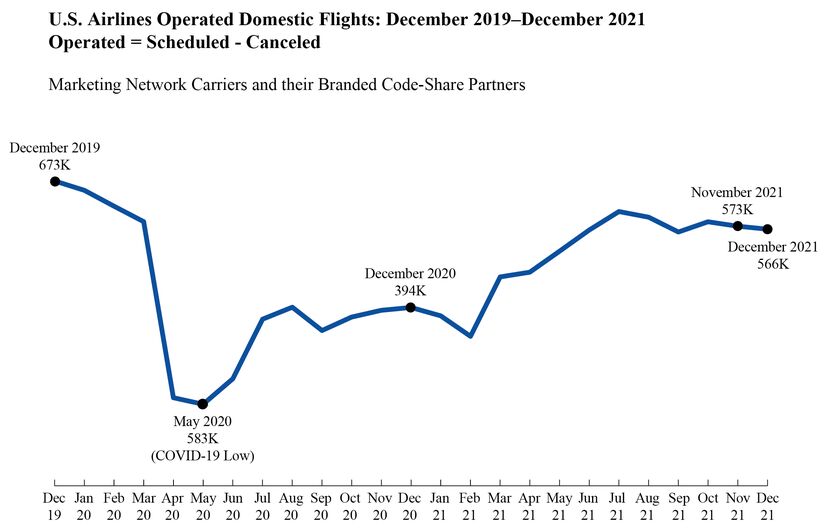
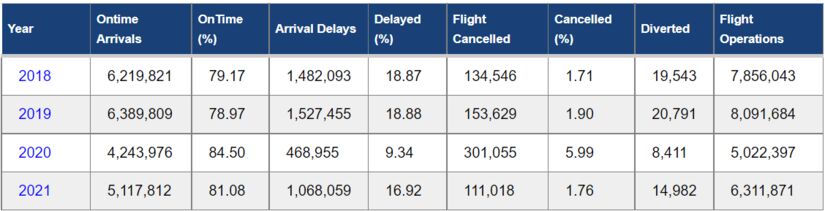
The US DOT says 6.2 million flights operated in 2021, a figure that is still only 78.1% of pre-pandemic levels (7.9 million). The top 10 marketing airline carriers
reported canceling 111,018 flights in 2021, or 1.76 of their scheduled flights – down from 1.9% in 2019.
The below information comes from a press release from the U.S. Department of Transportation. Highest/Reporting marketing carriers refer to the leading U.S. airlines by domestic market share in 2021.
-
Full-Year 2021 On-Time Arrival
Reporting marketing carriers posted an on-time arrival rate of 81.1% for 2021, down from an annual on-time arrival rate of 84.5% in 2020 but up from an annual on-time arrival rate of 79.0% in 2019.
Highest Annual On-Time Arrival Rates 2021
1. Hawaiian Airlines – 90.1%
2. Delta Air Lines Network – 88.2%
3. Alaska Airlines Network – 83.2%
Lowest Annual On-Time Arrival Rates 2021
1. Allegiant Air – 68.3%
2. JetBlue Airways – 72.3%
3. Southwest Airlines– 75.8%
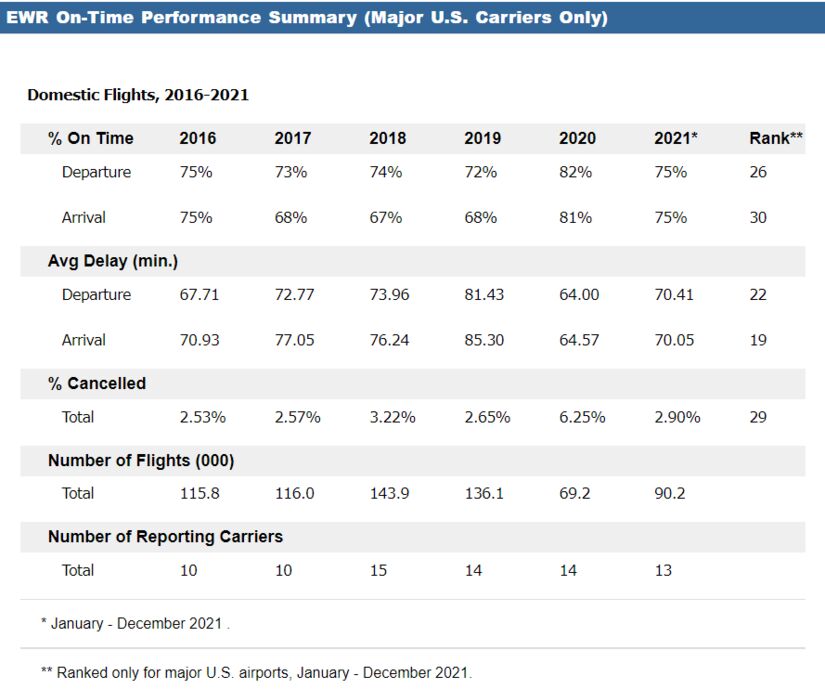 EWR on-time performance
December 2021 On-Time Arrival
In December 2021, reporting marketing carriers posted an on-time arrival rate of 76.0%, down from 84.3% in November 2021 and 87.2% in December 2020.
Highest On-Time Arrival Rates December 2021
1. American Airlines – 82.2%
2. Delta Air Lines Network – 80.0%
3. Hawaiian Airlines – 77.3%
Lowest On-Time Arrival Rates December 2021
1. Allegiant Air – 61.1%
2. JetBlue Airways – 64.5%
3. Alaska Airlines Network – 65.6%
 Airline Carriers, EWR
Full-Year 2021 Flight Cancellations
In 2021, the top airlines canceled 1.76% of their scheduled domestic flights, lower than the rate of both 6.0% in 2020 and 1.90% in pre-pandemic 2019. A flight is listed as canceled if it was listed in a carrier’s computer reservation system during the seven calendar days prior to a scheduled departure but was not operated.
Lowest Annual Rates of Canceled Flights 2021
1. Hawaiian Airlines – 0.4%
2. Delta Air Lines Network – 0.6%
3. Frontier Airlines – 1.4%
Highest Annual Rates of Canceled Flights 2021
1. Allegiant Air – 3.3%
2. Spirit Airlines– 3.0%
3. Southwest Airlines – 2.2%
December 2021 Flight Cancellations
In December 2021, reporting marketing carriers canceled 2.4% of their scheduled domestic flights, higher than the rate of both 0.6% in November 2021 and 1.1% in December 2020.
Lowest Rates of Canceled Flights December 2021
1. Southwest Airlines – 1.1%
2. American Airlines Network – 1.1%
3. Frontier Airlines – 1.6%
Highest Rates of Canceled Flights December 2021
1. Allegiant Air – 6.3%
2. Alaska Airlines Network– 5.5%
3. Spirit Airlines – 4.8%
Tarmac Delays
In December 2021, airlines reported 33 tarmac delays of more than three hours on domestic flights, compared to 2 tarmac delays reported in November 2021 and 3 tarmac delays reported in December 2020. In December 2021, airlines reported 0 tarmac delays of more than four hours on international flights, compared to 2 tarmac delays reported in November 2021 and 2 tarmac delays in December 2020.
For all of 2021, airlines reported 155 tarmac delays of more than three hours on domestic flights, up from 55 in 2020 and down from 305 in 2019. Also in 2021, airlines reported 33 tarmac delays of more than four hours on international flights, up from 6 in 2020 and 26 in 2019.
Airlines are required to have and adhere to assurances that they will not allow aircraft to remain on the tarmac for more than three hours for domestic flights and four hours for international flights without providing passengers the option to deplane, subject to exceptions related to safety, security, and Air Traffic Control related reasons. An exception also exists for departure delays if the airline begins to return the aircraft to a suitable disembarkation point to deplane passengers by those times.
Extended tarmac delays are investigated by the Department.
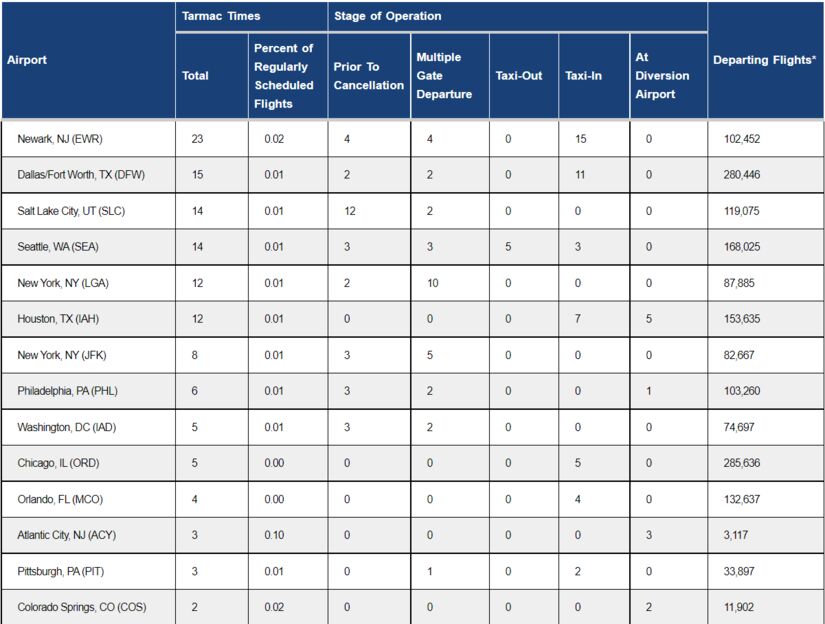 Tarmac time by leading airport
Mishandled Baggage
For the full year 2021, reporting marketing carriers handled nearly 393 million bags, posting a rate of 5.1 mishandled bags per 1,000 checked, which is higher than 2020’s rate of 4.1 and lower than 2019’s rate of 5.9.
In December 2021, reporting marketing carriers handled more than 40 million bags and posted a mishandled baggage rate of 6.6 mishandled bags per 1,000 checked bags, a higher rate than both the November 2021 rate of 4.6 and the December 2020 rate of 4.2.
Mishandled Wheelchairs and Scooters
For the full year 2021, reporting marketing carriers reported checking 532,306 wheelchairs and scooters and mishandling 7,239 for a rate of 1.36% mishandled. That is higher than the rate of 1.29% mishandled in 2020 but lower than the rate of 1.54% mishandled in 2019.
In December 2021, reporting marketing carriers reported checking 50,447 wheelchairs and scooters and mishandling 834 for a rate of 1.65% mishandled wheelchairs and scooters, lower than the rate of 1.73% mishandled in November 2021 but higher than the rate of 1.15% mishandled in December 2020.
Bumping/Oversales
Bumping/oversales data, unlike other air carrier data, are reported quarterly rather than monthly.
For the year, the reporting marketing carriers posted an involuntary denied boarding, or bumping rate of 0.17 per 10,000 passengers in 2021. That is higher than the rate of 0.11 in 2020 but lower than the rate of 0.24 in 2019.
For the fourth quarter of 2021, the 10 U.S. reporting marketing carriers posted an involuntarily denied boarding or bumping, rate of 0.23 per 10,000 passengers, higher than the rate of 0.16 in the third quarter of 2021 and the rate of 0.03 in the fourth quarter of 2020.
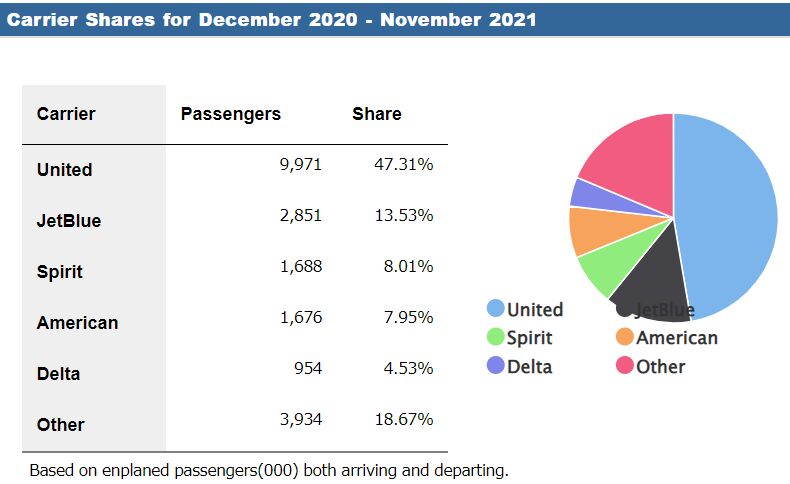
 Total passengers, EWR
Incidents Involving Animals
In 2021, carriers reported seven animal deaths, injuries to fourteen other animals, and zero lost animals, for a total of 21 incidents, up from the 10 incident reports filed for calendar year 2020 and up from the 19 incident reports filed for calendar year 2019. In 2021, 256,114 animals were transported by airlines, for a rate of 0.82 incidents per 10,000 animals transported. In 2020, 311,149 animals were transported, for a rate of 0.32 incidents per 10,000 animals transported. In 2019, 404,556 animals were transported, for a rate of 0.47 incidents per 10,000 animals transported.
In December 2021, carriers reported four incidents involving the death, injury, or loss of an animal while traveling by air, up from the one report filed in December 2020, and up from the one report filed in November 2021. The December 2021 incidents involved the death of one animal and injuries to three other animals.
Complaints About Airline Service
In 2021, the Department received 49,958 complaints. This is down 51.29 percent from the 102,560 complaints received in 2020 but up 225.84 percent from the 15,332 complaints received in 2019. Of the 49,958 complaints received in 2021, 29,507 (59%) concerned refunds.
In December 2021, DOT received 4,242 complaints about airline service from consumers, up 19.73 percent from the 3,543 complaints received in November 2021 and up 10.12 percent from 3,852 complaints filed in December 2020.
The Department’s Office of Aviation Consumer Protection continues to communicate with airlines and travel companies that receive refund complaints to ensure compliance with the refund requirements. Many passengers who had initially been denied refunds have received the required refunds. The Department has taken and will take enforcement action against non-compliant airlines and ticket agents as necessary.
 EWR, summary data
Complaints About Treatment of Disabled Passengers
In 2021, the Department received 1,394 disability complaints, up 157.67 percent from the total of 541 received in 2020 and up 54.03 percent from the 905 received in 2019.
In December 2021, the Department received a total of 180 disability-related complaints, up from the 146 disability-related complaints received in November 2021, and up from the 46 complaints received in December 2020.
Complaints About Discrimination
In 2021, the Department received 132 discrimination complaints – 81 complaints regarding race, 10 complaints regarding ancestry/ethnicity, 13 complaints regarding national origin, six complaints regarding color, nine complaints regarding religion, nine complaints regarding sex, and four complaints categorized as “other.” This is an increase of 169.39 percent from the total of 49 discrimination complaints filed in 2020 and an increase of 23.36 percent from the total of 107 discrimination complaints filed in 2019.
In December 2021, the Department received five complaints alleging discrimination – three complaints regarding race, one complaint regarding ancestry/ethnicity, and one complaint categorized as “other.” This is down from the 17 complaints received in November 2021 and remained the same from the five complaints recorded in December 2020.
Consumers may file air travel consumer or civil rights complaints online at http://airconsumer.dot.gov/escomplaint/ConsumerForm.cfm
or by voicemail at (202) 366-2220, or they may mail a complaint to the:
Aviation Consumer Protection Division, U.S. Department of Transportation, C-75, W96-432, 1200 New Jersey Avenue, SE, Washington, DC 20590.
Take a look at the average airline fare of the top 20 passenger-rated airports in the U.S.
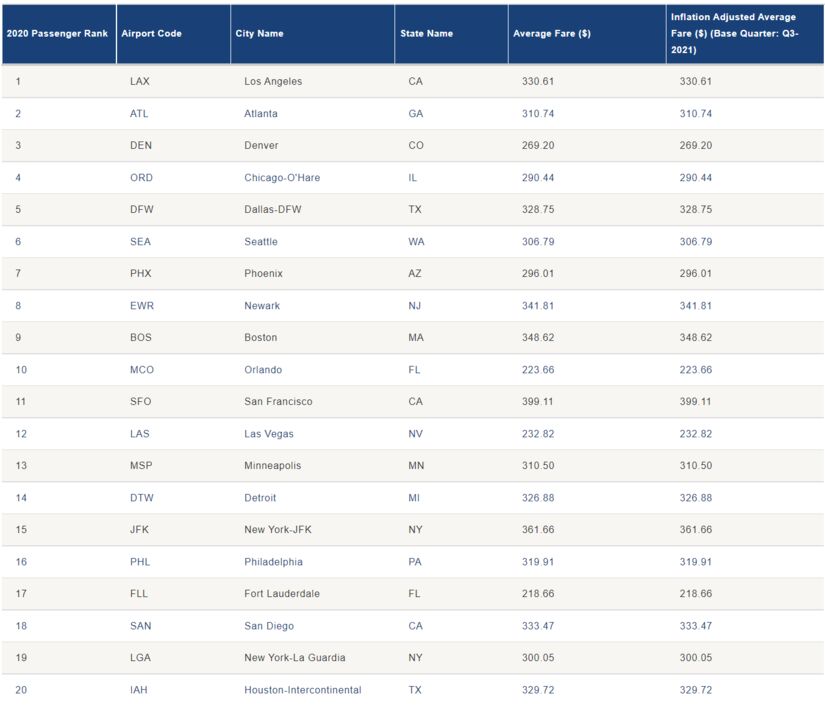 Average airline fare by top 20 US airports
Follow Morristown Minute on Facebook, Instagram, and Twitter for more local and state updates!


Patchy moderate snow, with a high of 32 and low of 19 degrees. Patchy moderate snow in the morning, partly cloudy during the afternoon, clear in the evening, light snow overnight.